Showing posts with label USDCAD. Show all posts

Monday, May 6, 2013

USDCAD Could Look for a Support This Week at Trend-line from 2012 Low


Canadian dollar has been one of the best performers last week and it gained strongly against the USD. We can see a sharp fall on USDCAD back to 1.0050 area, but still only into a third leg of decline from 1.0340, which is a structure of a contra-trend movements. Notice that pair is also still above the rising trend-line from 2012 low and also above 0.9930 critical level of wave X). With that said, it would be too soon to call end of a bullish period and look lower USDCAD; we still see current pull-back as wave B) that is part of a complex double zig-zag in wave (E). An impulsive reversal higher in the next week, back to 1.0200 would suggest another leg higher, this time to 1.0440 trend-line resistance where we would be looking for an end of a corrective wave (E) of X triangle as shown on the weekly chart.

Only sharp fall through 0.9930 would require a different outlook (ALT on the chart).

Try our services now for 7-days, absolutely free!

Friday, April 5, 2013

USDCAD Testing March Trend-line; Break Opens Door For 1.0300/50


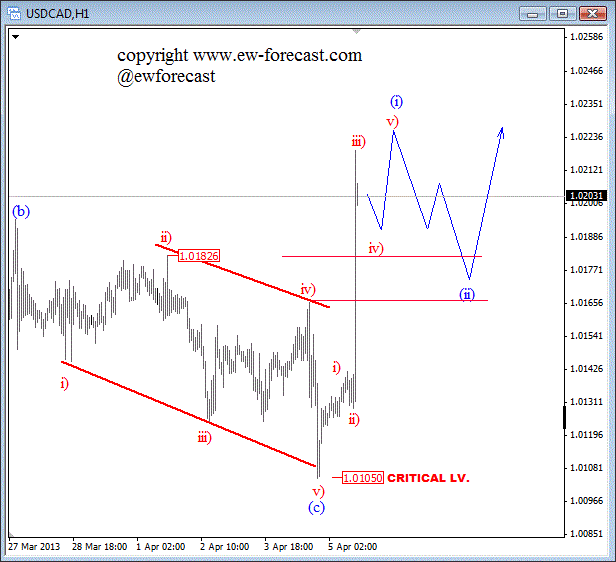
USDCAD reversed sharply higher after poor Canadian data; Trade Balance -1.0B and Employment -54.5K. Recovery on the intra-day chart from the low is quite sharp, probably impulsive wave (i) which could slow down around 1.0220/30 area.
 
Meanwhile we can also see that pair is testing falling trend-line on 4h chart connected from March highs. Break and daily close above this trend-line will be bullish signal for the next few days which will open the door for 1.0350. With that said, long positions could be interesting next week, but after a minor pull-back as shown on the hourly chart. 

USDCAD 1H Elliott Wave Analysis-Chart 

USDCAD 4H Elliott Wave Analysis Chart


For more free analysis and forecasts please visit our website at www.ew-forecast.com.
Special offer is available to new clients:
Get 2 Months For Price of 1

Tuesday, February 26, 2013

#USDCAD Could Make A Pull-back from 1.0280/1.0310 Within Extended Uptrend

USDCAD is higher, but pair could be in final stages of an uptrend in wave (iii) as we can count five waves up from 1.0000 with current fifth wave approaching to some key Fibonacci resistance levels around 1.0290. We know that after every five waves correction follows so reversal from here would not be a surprise but pull-back will be temporary blue wave (iv) that may retrace back to 1.0150-1.0200; wave four zone of one lesser degree. Keep in mind that larger trend for USDCAD is up, so we will continue to look higher after a pull-back while 1.0087 invalidation level is not breached.

Sentiment table
Current Trend/Sentiment Directional Bias Strategy
Up

Stay aside; waiting on fourth wave

USDCHF Technical Analysis - Sell at 0.9955

USDCHF made a nice bull move from 0.9716 to 0.9990. Then USDCHF drops from over bought zone. USDCHF is trading below its 20 period MA on 4h ...