Jan 29, 2013. Gold is in correction form toward 1670 area.
Buy Gold at/above 1655. Stop Loss at 1652 Target: 1670
Sell Gold at/below 1650. Stop Loss 1655 Target: 1635
Tuesday, January 29, 2013
GBPUSD: Price Could Retrace To 1.5800-1.5900 Within Larger Downtrend
Pound is falling sharply for the past two weeks from 1.6180 Jan 11 swing high. Notice that decline from that high can be easily counted in five waves. That’s called an impulsive structure which represents huge red wave 3) which is part of much bigger five wave decline started back on Jan 2nd. Therefore we expect much deeper levels on cable, but not just yet. In fact, we think that before market breaks lower again we will see a corrective bounce in wave 4), ideally back to 1.5800-1.5900 range before new sell-off begins. Pair is also approaching some strong Fibo support for current third wave; its 1.618 x wave 1) measured from wave 2) high which very often reacts as a turning point at the end of a third wave. In our case that’s comes in at 1.5650. Bottom line: watch for a corrective bounce in 100-200 pips before new leg lower.
Not a member yet?? Get more charts and forecasts with free access through 7-Day Trial Offer.
You can also follow us on twitter @ewforecast

Monday, January 28, 2013
Euro-Crosses should Extend Even Higher In Risk-On Environment-Elliott Wave
USD has been trading higher against its rivals during the Asian trading hours. AUD, GBP and CAD are still one of the weakest while JPY is trying to find some support for the near-term. Larger picture of the markets remains unchanged but still very messy.
Below we have an overlay chart between some major FX currencies compared to S&P Futures and Crude Oil. We can see a strong negative correlation between FX pairs where only the EUR is moving higher in-line with risk-on assets, such oil and S&P. Honestly, we do not like divergences too much, especially not between aussie and S&P which in fact could be signaling for a coming pull-back on stocks.
Overlay-Daily

Anyhow, traders need to trade what they see and not what they think, so at the moment looking for longs on EUR-crosses should be the best choice.
Below we are looking at EURCAD which is trading higher in wave (iii) that may slow down around 1.3630. Ideally we will see a fourth wave pull-back from there and back to 1.3500 which could be a long opportunity for short-term traders to catch wave (v) rally.
EURCAD 1h

Not a member yet?? Get more charts and forecasts with free access through 7-Day Trial Offer.
Friday, January 25, 2013
Elliott Wave Outlook For EURUSD and GBPUSD
Elliott Wave Outlook For EURUSD and GBPUSD
EURUSD
EURUSD
finally broke to the upside which was expected after few days of a sideways
price action in a shape of a triangle pattern. Pair already passed 1.3400
resistance level which now opens the door for 1.3500 or even 1.3550 level for
the next few days. Trend is bullish as long as market trades above 1.3260.
Meanwhile any pull-back to 1.3350 should prove corrective.

GBPUSD
Pound fell to a new low against the USD and
slowed down just 5 pips from 1.5750 projected level, highlighted
yesterday. Notice that pair now has five
waves down from 1.6180 which is the first evidence of a coming bounce,
especially if we respect the bullish divergence on the RSI. Larger pull-back
however could prove corrective and may stop at 1.5900 swing level that will may
react as a resistance.

Get more analysis and Elliott Wave forecasts directly from www.ew-forecast.com . Get free access now through 7-Day Trial Offer.
You can also follow us on twitter @ewforecast
Thursday, January 24, 2013
Silver: Corrective Pull-back Within Uptrend
Silver has
been in the uptrend-mode since start of January and it seems that bullish
momentum has started to weaken from 32.45 peak. This however is not a surprise
as market completed a fifth wave of a five wave sequence. In Elliott Theory we
know that after every five waves correction follows. The interesting thing is
that corrections usually starts after a divergence between wave 3 and wave 5
highs like in our case as shown on the MACD. Elliott Wave technicians will also
know that corrections are structured minimum by three waves, so traders should
be aware of a larger and deeper A-B-C pull-back possibly even back to 31
figure, near 38.2% retracement and Jan 17 swing level. After a completed three
wave fall traders should again be on the watch for a bullish turn.
Get more analysis and Elliott Wave forecasts directly from www.ew-forecast.com . Get free access now through 7-Day Trial Offer.
You can also follow us on twitter @ewforecast

Crude Oil Intraday! Heading toward wave V
Oil prices spiked up yesterday, closed to $97 per barrel before price turned sharply lower during the US trading hours. Looks like prices are capped now below 96.85 and ready for a deeper pull-back. We see market in minor fourth wave now from where extensions could follow to 94.80 later today. Any fast intra-day shorts should have stops above 96.15 critical region. Why? Because we know that wave four must not trade in to a territory of a wave one.

EURUSD Remains Trapped In Range, But Triangle Is Pointing Higher
Canadian dollar was one of the weakest
yesterday after BoC leaved rates unchanged at 1% due to weakness in the economy
and lowered GDP expectations for 2013 from 2.3% to 2.0%. IMF also lowered
global growth for 2013 but markets did not move much after the announcement.
Most of the FX pairs and major commodity markets are trading sideways while
stocks keep pushing higher. S&P500 slowed down yesterday 4 points ahead of
1500 psychological level.
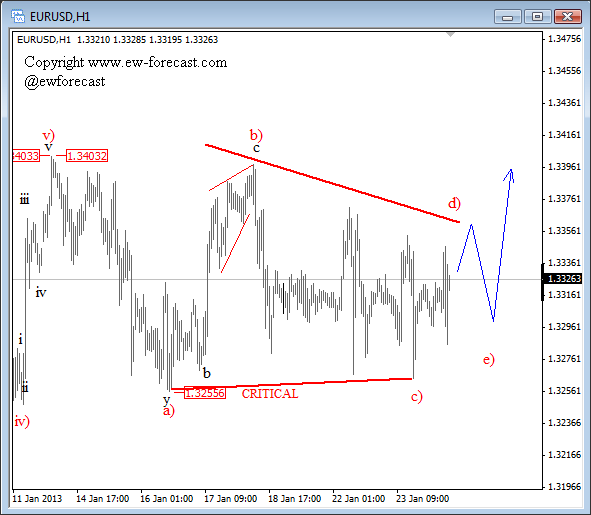
EURUSD tested 1.3250/60 support few sessions back from where we could see push higher today after just released better than expected German PMI numbers 48.8 vs. 47.1 expectation, but still in a contraction zone.
EURUSD tested 1.3250/60 support few sessions back from where we could see push higher today after just released better than expected German PMI numbers 48.8 vs. 47.1 expectation, but still in a contraction zone.
From an Elliott Wave perspective EURUSD still could be forming a triangle in wave four, but it’s hard to call the end of it. We need some impulsive reactions out of the path before direction of the pair can be confirmed.
You can also follow us on twitter @ewforecast
Subscribe to:
Posts (Atom)
USDCHF Technical Analysis - Sell at 0.9955
USDCHF made a nice bull move from 0.9716 to 0.9990. Then USDCHF drops from over bought zone. USDCHF is trading below its 20 period MA on 4h ...

-
Pivot: 87.65 Our preference: LONG positions above 87.65 with targets @ 89.6 & 90.8. Alternative scenario: The downside penetration ...
-
 AUDUSD turned sharply lower and made a daily close beneath rising trend-line connected from March lows. We also need to consider that...
-
 USDCHF made a nice bull move from 0.9716 to 0.9990. Then USDCHF drops from over bought zone. USDCHF is trading below its 20 period MA on 4h ...
