Showing posts with label EURUSD. Show all posts

Friday, May 17, 2013

EURUSD: Bearish Cycles Remains In Play-Elliott Wave Forecast

EURUSD reversed slightly higher yesterday from 1.2840 support but not for long as recovery found resistance very soon, so it was probably just a fourth wave within larger wave 3 down. As such, our bias remains unchanged we are looking for weaker EURUSD, towards 1.2800 as a next projected target where we could see a temporary low and a wave 4 pull-back. Short-term critical level is at 1.2935 as wave four must not trade into a territory of a wave one.

EURUSD 4h Elliott Wave Analysis Chart


For more analysis visit us at http://www.ew-forecast.com/ 

Monday, May 13, 2013

EURUSD: Broken Daily Trend-line puts The EUR in Bearish Mode


EURUSD fell sharply last week and closed well below 1.3034 swing low support which puts bearish price action in play. In fact, decline from 1.3195 was very strong and sharp which in many cases represents an impulsive wave and direction of a trend. As such, we need to respect this price action so we think it’s better to stick with the downtrend and look for possible short entries at this stage.

From an Elliott Wave perspective we are tracking one-two, one-two set-up with sub-wave (ii) now underway to 1.3020/50 resistance area.

The reason why we also expect bearish price action to continue is a broken channel line on the Daily chart as shown below. We however would turn bullish again only if we pass 1.3130 level. 

EURUSD Intra-day
EURUSD Daily
For more analysis visit our website and Try our services absolutely free for 7-days!  http://www.ew-forecast.com/service/

Tuesday, March 5, 2013

#EURUSD Broke 2012 Support Line; Can This Be Start of a Major Sell-off?!


Recently we were tracking a possible corrective decline from 1.3700 on EURUSD because of the overlapping structure. However, sharp and extended fall through 2012 support line with a weekly and monthly close price beneath it forced us to rework the count. In fact, we decided to check the line chart, where fall is pretty clean and directional. Move can be counted impulsively which that’s s bearish sign for the pair, but we expect a three wave bounce back to 1.3300 in March, before downtrend extends.

EURUSD daily- line chart


The reason why we also turned bearish on EURUSD is the overlay chart below which shows that most of other correlated markets turned lower, but not S&P which is still bullish but alone. This could be a sign and S&P is approaching to its top. If this proves correct and if S&P will turn lower from 1560-1600 then USD will probably accelerate sharply which is already showing strength without any S&P help.
Market Correlations


Friday, March 1, 2013

#EURUSD: Bearish But Overlapping

After quite slow price action in this week from 1.3018 low we decided to adjust the wave count and now looking for one leg down. The reason is the structure of a recent minor recovery, labeled on the chart as wave B which is looking corrective. As such, we think thats just another pull-back within ongoing bearish trend. We could see test of 1.2950 in sessions ahead, but keep in mind that these are final stages of a corrective movement and that our primary focus will be bullish when pair bottoms.

The fact is that despite strong bearish momentum decline from 1.3710 still can be corrective move, because each time when there was a bounce the market also made an overlap with former swing low.

Wednesday, February 6, 2013

USD Index Is Bullish For the Near-term Which Will Keep the #EURUSD Bellow 1.3710

USD Index has recovered very sharply from below 79.00 level. Recovery was impulsive so we need to respect this type of a price action, that’s why we turned bullish on the USD for a few days. Always when market will make just a corrective pull-back you need to remember that structure still needs to be made in three waves. If we look on our chart then we can clearly see that rise from the low is actually only in one completed leg; that’s wave (a), so be aware of more upside in this week. Ideally market is forming an (a)-(b)-(c) retracement, called a zig-zag towards 80.15-80.50 region. At that zone you will also notice a trend-line connected from November 16 which could react as a resistance if tested of-course.

For the very near-term we could see deeper levels in wave (b) with possible test of 79.40 region before wave (c) breaks higher.  With higher near-term prediction for the USD be aware of more weakness on EURUSD.

Thursday, January 24, 2013

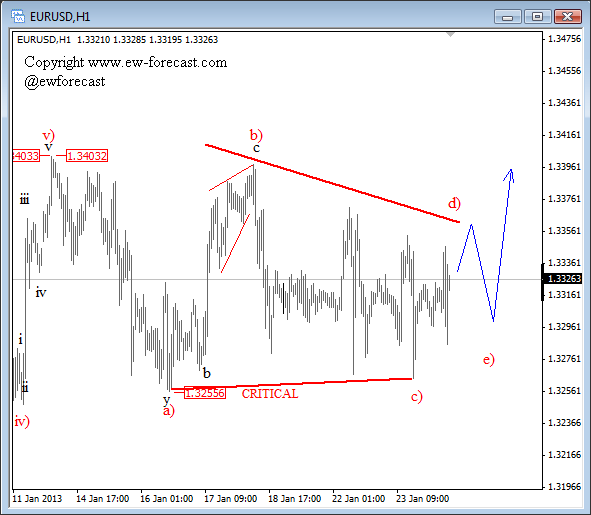
EURUSD Remains Trapped In Range, But Triangle Is Pointing Higher


Canadian dollar was one of the weakest yesterday after BoC leaved rates unchanged at 1% due to weakness in the economy and lowered GDP expectations for 2013 from 2.3% to 2.0%. IMF also lowered global growth for 2013 but markets did not move much after the announcement. Most of the FX pairs and major commodity markets are trading sideways while stocks keep pushing higher. S&P500 slowed down yesterday 4 points ahead of 1500 psychological level.

EURUSD tested 1.3250/60 support few sessions back from where we could see push higher today after just released better than expected German PMI numbers 48.8 vs. 47.1 expectation, but still in a contraction zone.

From an Elliott Wave perspective EURUSD still could be forming a triangle in wave four, but it’s hard to call the end of it. We need some impulsive reactions out of the path before direction of the pair can be confirmed.

Get more analysis and Elliott Wave forecasts directly from www.ew-forecast.com . Get free access now through 7-Day Trial Offer.

You can also follow us on twitter @ewforecast 

USDCHF Technical Analysis - Sell at 0.9955

USDCHF made a nice bull move from 0.9716 to 0.9990. Then USDCHF drops from over bought zone. USDCHF is trading below its 20 period MA on 4h ...